Engineering Velocity: Metrics, Bottlenecks, Solutions
Amit Eyal Govrin

TL;DR
- Velocity Defined: Story points/sprint measures team capacity; stabilizes after 4-7 sprints for reliable forecasting
- Business ROI: Top teams achieve 4-5x revenue growth, 60% higher returns via McKinsey Developer Velocity Index
- Case Studies: BETSOL 75% boost (monolith → microservices), Vymo 2.2x (EMP dashboards, 200+ releases/mo)
- Enterprise Gap: 80-90% post-POC velocity loss from 16-31wk governance/security delays (95% AI pilots fail)
- Kubiya Solution: Agentic Org automates KPIs → execution (Platform/SecOps agents + zero-trust), closes gap without headcount
Engineering velocity is a software development metric that measures the amount of work a software engineering team completes within a specific timeframe, often a sprint or iteration, typically quantified using story points or similar units. It is a key indicator of a team's productivity, efficiency, and ability to deliver new features, bug fixes, and improvements consistently. Engineering velocity helps organizations plan releases, forecast delivery timelines, and optimize workflows to meet market demands and customer needs effectively.
Engineering Velocity: Quantifying Output and Unlocking Team Capacity
What is Engineering Velocity?
Engineering velocity quantifies a team's capacity to deliver value in fixed periods like two-week sprints, using relative units like story points that account for task complexity rather than raw time. It typically stabilizes after 4-7 sprints, providing reliable data for future commitments while revealing crucial trends in process health.
Why Engineering Velocity Drives Business Success
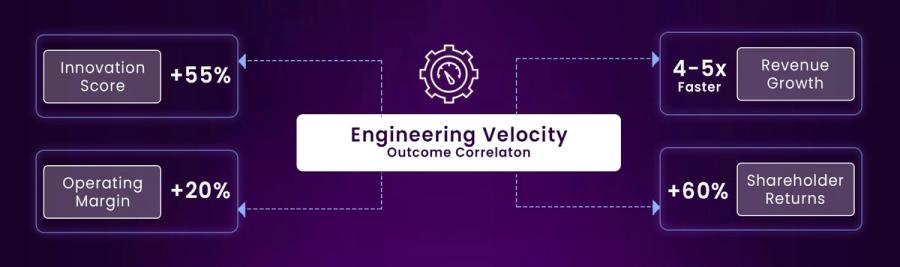
Engineering velocity directly correlates with business outcomes—top-quartile velocity teams achieve 4-5x faster revenue growth, 60% higher shareholder returns, and 20% better operating margins versus bottom performers. High-velocity organizations innovate 55% more effectively, score higher on customer satisfaction/brand perception, and attract top talent through dynamic environments.
Key Business Correlations
- Financial Impact: McKinsey's Developer Velocity Index shows elite teams deliver 4x revenue growth via faster market response.
- Innovation Edge: Velocity enables rapid customer feedback loops, boosting NPS and market share.
- Talent Magnet: Predictable delivery + visible impact retains engineers 2x longer.
- Leadership Decisions: Quantifiable metrics guide prioritization, hiring, and $14M+ annual savings (Nationwide case).
Velocity transforms engineering from cost center to business accelerator, justifying investments and aligning teams with profit drivers.
BETSOL Enterprise Case Study: 75% Velocity Boost
Engineering velocity was the core metric guiding BETSOL's transformation—tracking deployment frequency, cycle time, and throughput from monolith to microservices.
Where Engineering Velocity Operated
PRE: Manual Monolith → LOW VELOCITY (Months per release)
POST: Microservices + CI/CD → HIGH VELOCITY (Minutes per release)
Velocity Metrics Tracked:
- Deployment Frequency: Weeks → 200+ monthly releases (4-5x ↑)
- Cycle Time: Story → production took months → 3 days via Jenkins pipelines
- Throughput: 75% maintenance → 50% freed for new features
Manual Process Challenges → Velocity Killers
- Monolith Deployment: Single change = full redeploy (cycle time: weeks)
- Manual Handoffs: Cross-team delays (throughput bottleneck)
- Maintenance Trap: 75% capacity wasted (zero innovation velocity)
Velocity-Driven Migration
Strangler Pattern measured each microservice extraction's velocity impact:
| Velocity Stage | Metric Impact |
|---|---|
| Jenkins CI/CD | Deployment frequency: Minutes vs weeks |
| Cloud Foundry | Independent scaling: No monolith bottlenecks |
| 4,100 APIs | Throughput: Parallel development unlocked |
| Rally Dashboards | Cycle time visibility: 3-day E2E |
Results Quantified by Velocity Metrics
| Engineering Velocity Metric | Before → After | Business Impact |
|---|---|---|
| Deployment Frequency | Weeks → 200+/mo | 4-5x throughput |
| Cycle Time | Months → 3 days | 75% velocity ↑ |
| Maintenance Throughput | 75% trapped → 50% ↓ costs | Innovation capacity freed |
| System Availability | Outages → 99.95% | Reliable scaling |
Leadership ROI: Velocity metrics justified $M migration by proving 75% development velocity increase, enabling data-driven executive decisions.
Key Insight: Engineering velocity was the North Star—each migration step measured by deployment speed, cycle reduction, throughput gains—turning chaos into predictable enterprise delivery.
However, accurately measuring and maintaining high velocity becomes a significant challenge as engineering teams scale, facing increasingly complex workflows and potential bottlenecks.
Enterprise Case Study: The Vymo Challenge
Industry Example: Vymo
Vymo, serving banks/insurers, restored engineering velocity amid scaling chaos through metrics-driven fixes, turning multi-environment bottlenecks into predictable delivery.
Challenges Killing Velocity
- Manual 15+ Global Environment Management: Release delays across clouds/regions due to inconsistent processes and tracking.
- Lean Ops Overload: Small team juggled Kubernetes migration, Azure optimization, and high-frequency releases simultaneously.
- Over-Provisioning Waste: Application code assumptions blocked elastic scaling, causing 12%+ cloud cost overruns.
Velocity-Driven Solutions
Implementing an engineering management platform provided the diagnostic lens needed for precise interventions:
- Release Frequency Boost: Centralized Facets automation enabled 200+ monthly releases (from manual delays), directly measuring deployment throughput velocity.
- Throughput Gains: Cycle time/throughput dashboards exposed code review bottlenecks, delivering 2.2x project velocity via targeted fixes.
- Cycle Time Reduction: Unified metrics visibility shortened end-to-end workflows, eliminating multi-environment coordination friction.
- Operational Efficiency: Enriched logs + elasticity cut costs 12% while proactive alerting sustained reliability velocity.
Measurable Velocity Transformation
| Velocity Metric | Before | After | Impact |
|---|---|---|---|
| Release Frequency | Manual delays | 200+ monthly | 4-5x throughput |
| Project Velocity | Bottlenecked | 2.2x increase | Doubled capacity |
| Cycle Time | Prolonged reviews | Shortened via dashboards | Shortened via dashboards Bottlenecks eliminated |
| Cloud Efficiency | Over-provisioned | 12% cost reduction | Resource velocity optimized |
| Uptime | Risk-prone | High availability | Reliability sustained |
Insight: Velocity isn't "speed" it's system capacity. Vymo fixed tooling (Facets), BETSOL fixed architecture (microservices)—both measured via deployment frequency/cycle time.
Factors Influencing Engineering Velocity
Engineering velocity emerges from interconnected human, process, and technical factors—each amplifying or constraining team output.
Core Influencers by Category
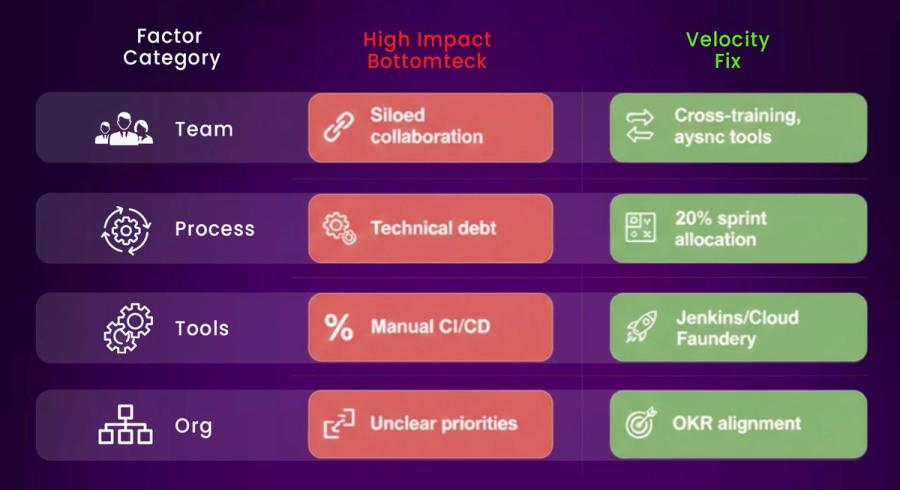
Team Dynamics
- Composition & Skills: Seniority gaps slow onboarding/innovation
Google: DORA metrics showed junior-senior imbalance caused 30% deployment delays until cross-training.
- Collaboration: Siloed roles create 40% cycle time waste
Amazon: Context switching across teams reduced throughput 25% pre-Kanban.
- Psychological Safety: Fear reduces experimentation
Microsoft: Visual Studio UX redesign cut cognitive load 30%, boosting velocity
Process & Methodology
- Development Approach: Agile/Scrum accelerates iteration; Waterfall creates sequential bottlenecks.
- Technical Debt: Accumulated shortcuts consume 75% capacity (Vymo/BETSOL cases).
- Requirements Clarity: Ambiguous specs cause 30% rework velocity loss.
Tools & Technology
- Tooling Friction: Fragmented stacks (Jira/GitHub/AWS) erode 25% throughput.
- Automation Gaps: Manual testing/CI/CD doubles cycle times.
- Platform Maturity: Monoliths vs microservices (BETSOL: 75% velocity delta).
Organizational & External
- Culture/Leadership: Micromanagement kills autonomy; empowerment boosts 2x velocity.
- Regulatory/Market: Compliance scope creep, shifting priorities disrupt sprints.
- Resource Allocation: Understaffing, budget constraints cap throughput.
Velocity Impact Matrix
Strategies to Improve Engineering Velocity
Common approaches boost velocity 2-5x by targeting prioritization, debt, automation, culture, and measurement across enterprise teams.
Proven Strategies with Enterprise Examples
- Clear Goal Prioritization: OKRs + value-stream mapping cut context switching 30% Google used DORA metrics to focus high-impact features, achieving 4x deployment frequency.
- Technical Debt Reduction: 20% sprint allocation frees 50-75% capacity Etsy quarterly debt sprints improved throughput 3x via CI/CD automation.
- Streamlined Release Processes: CI/CD pipelines slash cycles weeks → minutes Faire scaled from 5 to 50 engineers without re-architecting via solid pipelines.
- Psychological Safety: Blameless retrospectives boost innovation 55% Microsoft regular retrospectives cut defects 15%, accelerating experimentation.
- Intelligent Measurement Tools: EMPs/AI dashboards reveal bottlenecks real-time Scope3 AI QA unified tools, delivering 20+ releases/week (2x velocity).
Enterprise Problems Slowing Engineering Velocity
Enterprises encounter sequential, compounding delays post-POC that erode velocity by 80-90% in AI/ML initiatives, creating the "velocity gap" where demos succeed but production stalls.
Problems with Impact Analysis
POC vs Production Gap (16-31 Weeks)
Timeline Breakdown:
- Pilot/POV: 2-6 weeks ✓ (Success demo)
- Secure integrations/hardening: 4-8 weeks (Zero-trust, encryption)
- Policy/governance layer: 4-6 weeks (Approvals, audit logs)
- Observability/runbooks: 3-6 weeks (Monitoring, incidents)
- Rollback/SLA/scaling: 3-5 weeks (HA, disaster recovery)
Result: 95% of enterprise AI pilots fail before production—endless pilots with undefined KPIs.
Security & Compliance Drag
Issue: AI works isolated but blocks at production gates
Example: Cost-optimization agent needs audit trails (SOC2), access controls (zero-trust), data classification before deployment.Velocity Impact: 4-8 week delays per initiative, no parallel work possible.
Policy & Governance Complexity
Issue: Nuanced rules across regions/teams applied manually
Example: GDPR/SOC2/HIPAA compliance + LLM usage limits + approval workflows enforce inconsistently.Velocity Impact: Manual gates, rework cycles, no deterministic execution.
Observability & Operational Readiness
Issue: AI live without dashboards/alerts
Example: Cost agent saves $M but no budget spike alerts, no error tracking, no runbook for failures.Velocity Impact: Executives halt rollout, weeks of retrofitting observability.
Rollback, SLAs, and Scaling
Issue: Multi-cloud deployment without safe rollback
Example: Agent deployed to Azure but dependent on AWS Lambda; breaking change = uncontrolled blast.Velocity Impact: Heavy SRE work pre-deployment (weeks of planning).
Fragmented Tooling & Context Loss
Issue: Data silos across AWS, K8s, GitHub, CI/CD, ticketing
Example: No unified graph of "which services call this API?" → brittle scripts, duplicated logic.Velocity Impact: 25% throughput lost to manual context gathering.
AI "Adopted" in Slide Decks Only
Issue: Roadmaps show AI live; ops teams see integrations failing
Example: Product deck: "Launch ML cost optimizer Q1." Reality: Incomplete Terraform sync, security scan failures, no cost model docs.Velocity Impact: Credibility loss, executive distrust.
Human-Heavy DevOps/SRE Toil
Issue: Manual script-gluing replaces governance
Example: Cost agent needs API integration (8hrs script), approval workflow (manual Jira), monitoring setup (custom config).Velocity Impact: 75% Ops capacity = toil, 25% = innovation.
No Single Accountable Engineering Org
Issue: Fragmented ownership—PM owns delivery, security owns approval, platform owns infra, nobody owns integration.Velocity Impact: Constant renegotiation, blocked decisions, no clear exec accountability.
How Kubiya Solves Enterprise Velocity Problems
Kubiya's Agentic Engineering Org delivers an always-on, policy-driven system that closes the 16-31 week post-POC velocity gap by automating from KPIs → proven outcomes, without headcount growth.
1. KPIs to Execution (Solves: POC-Prod Gap + No Accountable Org)
Problem: Business intent ("cut cloud costs 20%") gets lost in handoffs; 95% pilots undefined.Kubiya Solution: AI product management translates KPIs → scoped PRDs → specialized agents.
- Platform Agent: Infrastructure optimization
- SecOps Agent: Security hardening
- FinOps Agent: Cost control
- SRE Agent: Reliability/scaling
Impact: Single ownership chain, clear accountability, deterministic execution.
2. Autonomous Agents (Solves: Human-Heavy Toil + Fragmented Tooling)
Problem: 75% DevOps capacity trapped gluing scripts/APIs manually.Kubiya Solution: Domain agents handle integrations via 100+ pre-built connectors (Terraform, Jenkins, AWS, K8s, GitHub).
- Replaces manual Terraform scripts with agent-driven IaC
- Auto-approves workflows via policy (not Jira tickets)
- Parallel execution across multi-cloud
Impact: Toil → automation, 75% capacity freed for innovation.
3. Zero-Trust Governance (Solves: Security & Compliance Drag + Policy Chaos)
Problem: Security gates add 4-8wks; governance applies inconsistently across regions.Kubiya Solution: OPA policy-as-code + RBAC + audit logs embedded from runtime start.
- Deterministic execution (no manual approvals)
- Policies enforce globally (data residency, LLM limits, spending caps)
- Audit trail automatic (no post-hoc compliance workarounds)
Impact: 4-8 week security delays → built-in compliance, parallel fast-track.
4. Production Architecture (Solves: Rollback/SLAs + Observability)
Problem: Multi-cloud deployments risky; no safe rollback; incidents untracked.Kubiya Solution: MicroVM-isolated distributed control plane + durable orchestration.
- Pollution-proof execution (agent failures isolated)
- Deterministic rollbacks (event replay)
- Built-in observability (all state logged)
- SLA-ready scaling (horizontal worker pools)
Impact: Production readiness native, weeks of SRE pre-work → day-1 live.
5. Unified Context (Solves: Tool Fragmentation + Context Loss)
Problem: AWS/K8s/GitHub silos cause duplicated logic, brittle scripts.Kubiya Solution: Real-time context graph syncs infrastructure/events across all tools.
- Vector DB of current state (no stale data)
- Semantic relationships (API X calls Lambda Y in region Z)
- Enables durable, informed workflows (agents act on real-time truth)
Impact: 25% throughput loss eliminated, automation reliable vs brittle.
6. ROI Tracking (Solves: Pilot Purgatory + Undefined KPIs)
Problem: "Launched Q1 AI initiative" no metrics, no ROI, exec distrust.Kubiya Solution: Automatic lifecycle metrics (hours saved, costs cut, KPI progress).
- Hours saved (vs manual ops work)
- Cost reductions (FinOps agent efficiency)
- KPI delta (baseline vs achieved)
Impact: Ends pilot purgatory proves ROI, enables scaling decisions.
Conclusion
Mastering engineering velocity transforms teams from reactive firefighting to predictable business accelerators Vymo achieved 2.2x throughput via EMP dashboards, BETSOL unlocked 75% capacity through microservices migration, while enterprises lose 80-90% post-POC to governance chaos. Velocity emerges from aligned human dynamics, streamlined processes, mature tooling, and empowered culture, compounded through measurement (DORA/cycle time), prioritization (debt sprints), and automation (CI/CD). Kubiya's Agentic Engineering Org closes the 16-31 week velocity gap with end-to-end KPI execution, zero-trust governance, and ROI tracking proving top-quartile teams deliver 4-5x revenue growth without headcount expansion. Measure your baseline today: velocity isn't speed, it's enterprise capacity unlocked.
FAQs
1. How do you calculate engineering velocity?
Velocity = Total story points completed / Number of sprints. Track complementary DORA metrics (deployment frequency, cycle time, throughput) for complete picture. Stabilizes after 4-7 sprints.
2. Why do enterprises lose 80-90% velocity post-POC?
16-31 week "velocity gap": 4-8wks security hardening + 4-6wks governance + 3-6wks observability + 3-5wks scaling. 95% AI pilots fail due to operational/governance friction, not technical feasibility.
3. What's the difference between velocity and developer productivity?
Velocity = team system capacity (predictable delivery). Individual speed varies; focus DORA metrics (deployments/day, lead time) + psych safety for sustainable gains. Vymo: 2.2x via dashboards, not headcount.
4. How does Kubiya close the enterprise velocity gap?
Agentic Engineering Org: KPIs → PRDs → autonomous Platform/SecOps/FinOps/SRE agents with zero-trust OPA governance, 100+ connectors, microVM isolation. Eliminates 16-31wk delays—day-1 production-ready.
About the author
Amit Eyal Govrin
Amit oversaw strategic DevOps partnerships at AWS as he repeatedly encountered industry leading DevOps companies struggling with similar pain-points: the Self-Service developer platforms they have created are only as effective as their end user experience. In other words, self-service is not a given.