What is AIOps in a Cloud-Native World: SRE and DevOps Use Cases
Amit Eyal Govrin

TL;DR
- AIOps enhances DevOps and SRE workflows by applying machine learning and automation to noisy, distributed infrastructure.
- It helps correlate alerts, identify root causes, and reduce false positives across cloud-native environments.
- According to Gartner, 80% of ITOps teams plan to adopt AIOps platforms by 2026 to handle growing operational complexity.
- AIOps integrates with tools like Prometheus, Kubernetes, Terraform, and CI/CD pipelines to enable intelligent, automated responses.
- Kubiya brings AIOps to life through memory-scoped AI agents that execute context-aware actions via Slack, CLI, or automation triggers.
- The result is faster incident response, reduced on-call fatigue, and more reliable operations at scale.
Modern infrastructure is fast, distributed, and inherently noisy. For SREs and DevOps engineers, this translates into a daily grind of juggling fragmented dashboards, sifting through overwhelming log volumes, and responding to alert floods, many of which turn out to be false positives or repetitive incidents. This constant cognitive load erodes productivity and increases the risk of human error during critical events.
This is where AIOps for DevOps(Artificial Intelligence for IT Operations) enters the scene. AIOps adds a contextual intelligence layer to operational workflows, enabling systems to not only detect anomalies but also correlate disparate signals, surface root causes, and automate remediation workflows. According to Gartner, 40% of I&O teams will use AI-augmented automation in large enterprises by 2025, up from less than 10% in 2022. Another Gartner forecast suggests that by 2026, over 80% of ITOps teams plan to adopt AIOps platforms to keep pace with the complexity of hybrid and multi-cloud ecosystems.
These trends highlight a clear shift: rule-based automation alone can no longer scale with modern systems. What teams need is adaptive, data-driven intelligence that actively collaborates with engineers, an evolution from static scripts to AI-native operations.
In this post, we’ll explore AIOps in cloud-native environments. We’ll also see how Kubiya, an agent-based orchestration platform, helps DevOps and SRE teams embed AIOps into their daily workflows without adding complexity.
What is AIOps in a Modern Cloud-Native Stack
At its core, AIOps combines the modernization of IT operations with the analytical power of artificial intelligence. In cloud-native environments, where services are containerized, distributed across multiple clouds, and often short-lived, AIOps platforms ingest and analyze telemetry from a wide range of sources: logs, metrics, events, traces, and deployment data. But AIOps isn’t just about aggregation; it's about intelligence. The goal is to enrich incoming signals with topology context, correlate them across layers, and surface insights that enable real-time decision-making and autonomous actions.
There are two fundamental approaches to how AIOps interprets this complexity: deterministic AIOps and machine learning-driven AIOps.
Deterministic AIOps is rooted in causal understanding. Instead of relying on probabilistic models, it works off a dynamic, real-time model of how the system is expected to behave, essentially, a live architectural map. Here, the “pattern” isn’t something to discover; it’s already known, and the AI monitors for deviations from this known structure. This approach is particularly useful in systems where component behavior is tightly coupled and where understanding causal links is critical. For example, if a downstream service fails, deterministic AIOps can pinpoint the exact propagation path through the dependency graph and identify the true root cause, not just correlated symptoms. Context isn’t added later, it’s built in from the start, forming the backbone of this intelligent system.
In contrast, machine learning-driven AIOps is probabilistic and pattern-seeking. It sifts through massive volumes of observability data to uncover trends, correlations, and anomalies. This approach is more flexible and scalable in environments with high entropy, such as those with multiple teams, loosely coupled services, and varied infrastructure stacks. However, it has limitations. In multicloud or hybrid environments, correlation often doesn’t imply causation, and distinguishing signal from noise becomes exponentially harder as ephemeral workloads come and go. A failed pod might correlate with a recent deployment, but was it the deployment itself, the underlying node pool, or a config change triggered by a parallel pipeline? In these scenarios, ML-based AIOps can surface potential issues, but not always with explainable or reliable precision.

Ultimately, the most effective AIOps platforms blend both paradigms, using deterministic logic for structural awareness and machine learning for adaptability in fluid systems. Kubiya’s agent-based orchestration supports this hybrid approach by leveraging both memory-scoped context (deterministic) and AI/ML models (probabilistic) to deliver accurate, real-time automation with explainable decision paths.
Core Components of AIOps in Practice
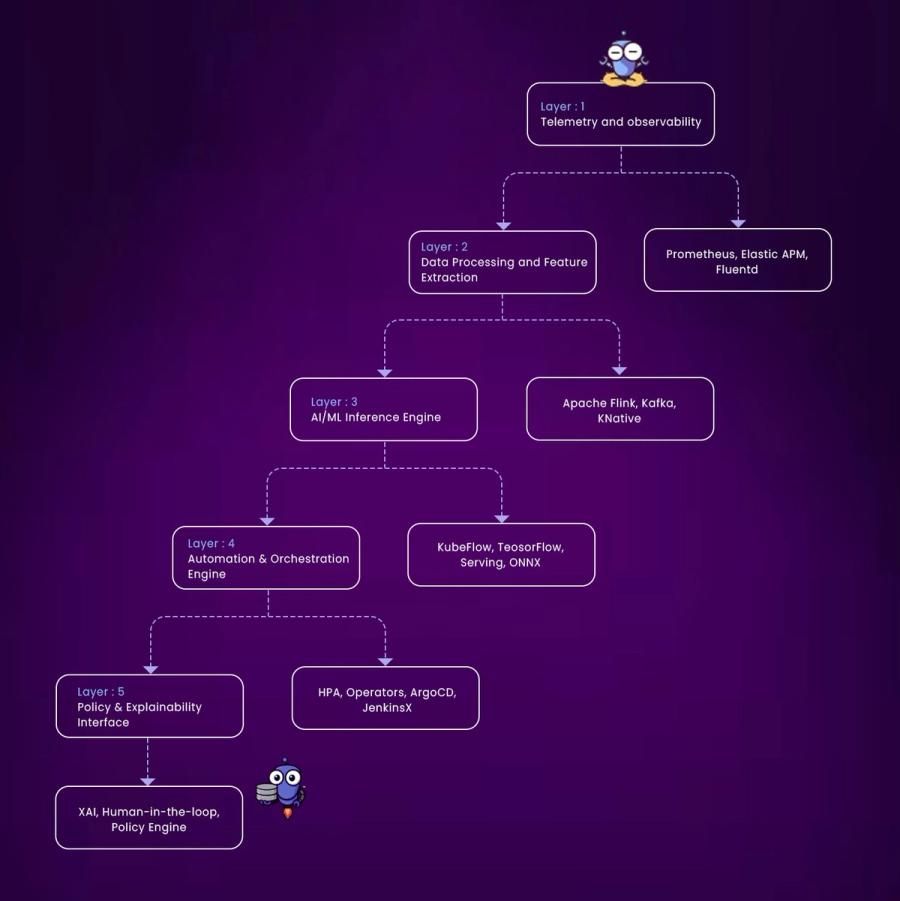
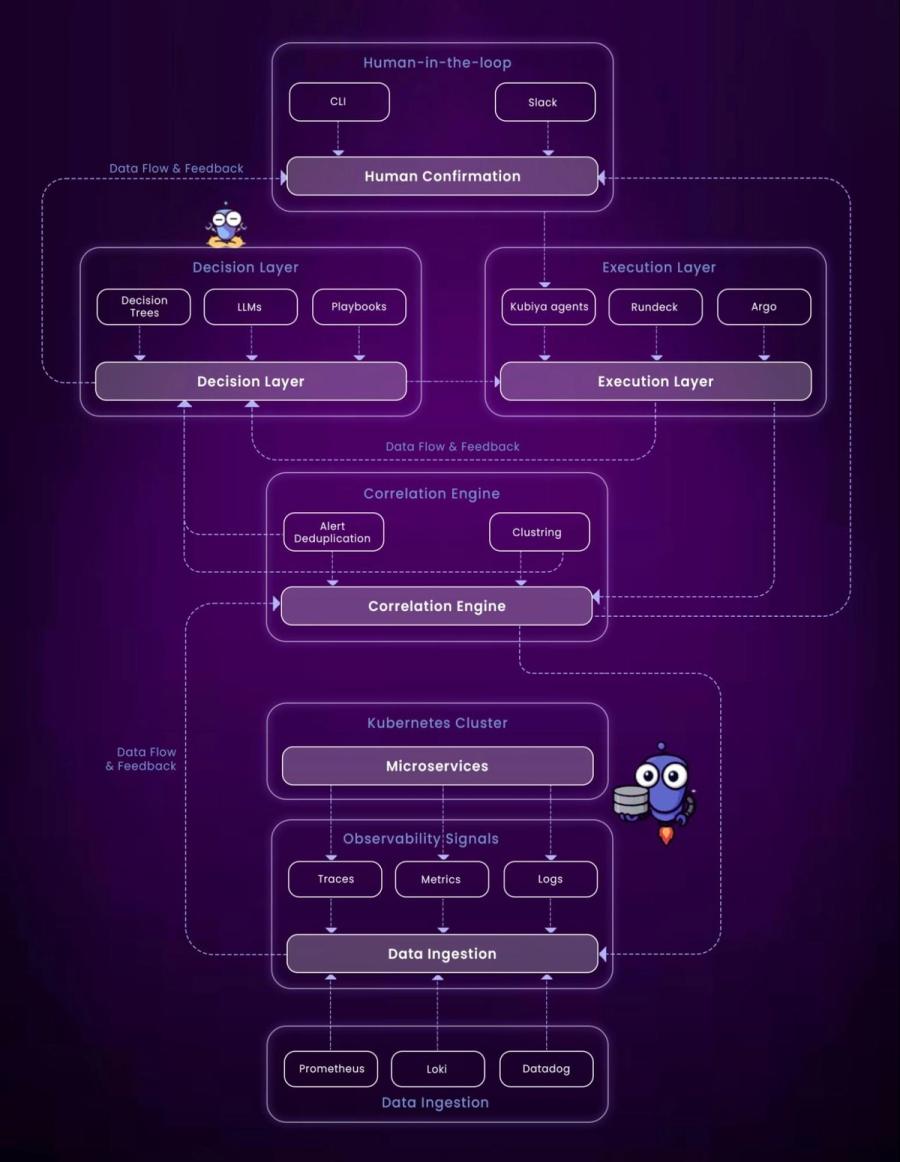
A mature AIOps deployment, especially in cloud-native environments, can be decomposed into four foundational layers: data ingestion, correlation, decision-making, and execution. Everything begins with ingestion. AIOps platforms are wired into the telemetry backbone of the system, consuming metrics from sources like Prometheus or Datadog, logs from Fluentd, Loki, or the ELK stack, traces from platforms like Jaeger or OpenTelemetry, and events from infrastructure systems like Kubernetes, ArgoCD, Jenkins, and Terraform.
Once ingested, data is normalized and fed into a correlation engine. This engine bridges the semantic gap between individual signals. It identifies patterns that span services and deduplicates recurring alerts. For example, when five services simultaneously trigger latency alerts after a database deployment, the correlation engine might group these into a single root event, "increased DB response time post-deploy." Powerful models, such as clustering algorithms like KMeans or supervised models trained on historical outages, form the predictive muscle of this layer. These engines not only alert on issues but classify and rank them in terms of impact, confidence, and urgency.
Next, the decision layer interprets, reasons, and formulates a response. Here, platforms might use LLM for DevOps (large language models), condition-based playbooks, graph-based algorithms, or decision trees. This layer decides: should the system notify the on-call engineer or attempt a rollback? Is this failure transient, or symptomatic of a larger issue? The models anchor their decisions on stateful context, enrichment metadata, and historical outcomes.
Finally, the execution layer brings conclusions to life through real-time workflows. This layer can invoke automated fixes, fire off CI/CD rollbacks, apply Terraform plans, open incidents in systems like PagerDuty, or notify Slack channels with summaries and recommendations. Execution engines might run in systems like Argo Workflows or Rundeck, or they might be tightly coupled AIOps orchestration platforms like Kubiya that abstract operational logic behind intelligent agents capable of threading human intent and automation.
Together, these layers create a closed-loop feedback system: from detection to decision to action. In an ideal state, they enable not just auto-remediation but predictive, preventative interventions, mitigating risks before they result in outages.
AIOps Use Cases for SREs and DevOps
The practical value of AIOps becomes clear when you zoom in on real-world challenges SREs and DevOps teams face daily. From managing incident fatigue to scaling infrastructure efficiently, AIOps brings intelligent automation to areas that were historically manual, brittle, and reactive.
1. Incident Management and Root Cause Analysis
In traditional setups, incident triage often means hopping between dashboards, reviewing logs, and correlating symptoms manually, a time-consuming and error-prone process. AIOps platforms streamline this by automatically detecting failure patterns in logs, metrics, and events. For instance, if a spike in 5xx errors aligns with a recent deployment and correlates with increased memory usage, AIOps can flag the incident, trace it to the rollout, and even propose (or execute) a rollback. For SREs tasked with maintaining uptime, this shortens mean time to resolution (MTTR) drastically and improves reliability metrics like SLO compliance.
2. Anomaly Detection and Predictive Alerts
One of the most powerful aspects of AIOps is its ability to detect subtle deviations in behavior before they evolve into critical failures. In cloud-native environments, workloads are ephemeral and traffic patterns can change rapidly, making static thresholds useless. AIOps systems learn baseline behavior over time and detect anomalies in real-time, such as increased disk latency or unusual outbound traffic from a pod. Instead of reacting to incidents after the fact, teams can proactively address root causes with predictive alerts and context-aware insights.
3. Resource Optimization
Cloud-native systems are elastic by design, but manual resource tuning remains a major operational burden. AIOps platforms analyze historical usage patterns, understand service behavior under different loads, and suggest, or automatically enforce, resource allocations. For example, a backend API that always hits CPU limits during a specific traffic window can be automatically scaled ahead of time. Similarly, underutilized containers can be consolidated to optimize cloud spend. This intelligent scaling reduces waste while ensuring performance stays within acceptable thresholds.
Key AIOps Tools in Cloud-Native Environments
AIOps is not a monolith, it’s an ecosystem of tools, each with strengths in specific areas such as observability, alerting, correlation, or orchestration. Many modern platforms embed AIOps capabilities natively, enabling intelligent operations on top of cloud-native stacks like Kubernetes, serverless, and distributed microservices.
1. Datadog
Datadog is a well-established observability platform that layers AIOps functionality on top of logs, metrics, traces, and events. It supports intelligent alerting through Watchdog, which uses ML to detect unexpected behavior and suggest relevant dashboards or queries. In Kubernetes environments, it correlates container-level metrics with pod events, helping teams diagnose regressions or resource contention. Its integration with Slack and PagerDuty allows for rapid triage and response, making it a go-to for cloud-native monitoring at scale.
2. Dynatrace
Dynatrace goes beyond simple telemetry by building a real-time dependency graph of your entire stack, from infrastructure to user sessions. It applies causal AI (its deterministic engine) to automatically detect and explain incidents, complete with impact analysis. This makes it particularly effective for microservices-based architectures, where tracing an issue across services and functions manually would take hours. For DevOps teams, Dynatrace reduces alert fatigue by surfacing only actionable issues.
3. New Relic
New Relic combines infrastructure monitoring, application performance management (APM), and distributed tracing with built-in AIOps. It can automatically suppress redundant alerts, group related anomalies, and highlight changes that likely caused a performance shift. Its ML models operate on telemetry across the full stack, from frontend latency to backend bottlenecks. In cloud-native use cases, this means faster root cause analysis, intelligent alert routing, and automatic metric baselining.
4. Moogsoft
Moogsoft is an AIOps-first platform focused on event correlation and noise reduction. It excels at aggregating signals from different observability stacks, logs, metrics, traces, and applying clustering algorithms to group them into meaningful incidents. It’s particularly valuable in environments like Kubernetes where a single failure might trigger dozens of alerts. By deduplicating and correlating these events, Moogsoft gives SREs a clear, concise incident summary rather than a wall of noise.

Where AIOps Meets Cloud-Native DevOps
For teams steeped in DevOps methodologies, AIOps can seem like a natural, long-overdue evolution. DevOps emphasizes continuous integration, continuous delivery, monitoring, feedback loops, and automation. Where AIOps builds on DevOps is in its ability to automate judgment, the decisions traditionally made by SREs or ops engineers when interpreting complex signals. It turns latency spikes, failed PR checks, pipeline anomalies, and deployment regressions into actionable feedback on their own, reducing reliance on manual intervention.
For example, intelligent rollbacks have become commonplace with AIOps. If a new service deployment increases error rates by 40%, AIOps systems can detect the correlation between the spike and the recent container image push, and revert to a previous good state, automatically. Likewise, scaling becomes dynamic and ML-driven rather than predefined. Resource-intensive jobs might see their memory allocations bumped on the fly based on usage and trend analysis, rather than waiting for HPA rules to kick in (which may not address CPU throttling, for instance).
GitOps workflows also benefit significantly. Post-merge validations can now go far beyond passing integration tests. AIOps can analyze real-time deployment health, scan correlated performance regressions, and even prevent promotions to production until metrics stabilize. In this way, ML-powered validation extends the definition of “done” for PRs into runtime.
Within SRE domains, AIOps is a game-changer for SLO management. Instead of relying on hardcoded thresholds, "alert if error rate > 5%", AIOps systems analyze behavior over time and calculate dynamic thresholds. This adaptive approach is less prone to false positives and better aligned with real-world workload variance. For instance, if traffic routinely spikes during nightly batch jobs causing elevated latency, a fixed alert threshold would trigger unnecessary pages. AIOps understands the context and adjusts baselines automatically.
A practical example might involve Kubernetes AIOps pods crashing after a Helm upgrade. In traditional systems, engineers would sift through logs, correlate events, and identify that memory limits were reduced during the update. AIOps systems, however, can trace the incident directly to the Helm chart diff, interpret crash signatures like OOMKilled, and recommend or execute a rollback to the previous memory configuration, all without the engineer having to dig.
How Kubiya Enables AIOps via AI Agent Orchestration
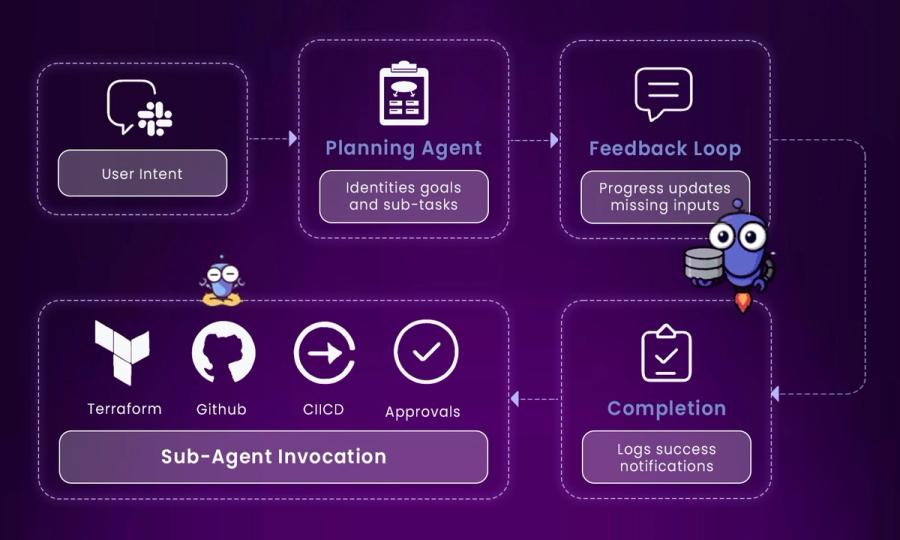
Here is the step by step explanation of how Kubiya’s AI Agent Orchestration Lifecycle work:
User Intent (Input Stage):
- A user issues a request via natural language (e.g., in Slack, CLI, or Teams).
- Example: “Rollback the last deployment for checkout service.”
Planning Agent (Task Breakdown):
- The core Kubiya planning agent interprets the intent.
- It identifies the goal, breaks it down into sub-tasks, and decides what needs to happen next.
- Think of this as an internal planner translating human intent into a sequence of automated steps.
Feedback Loop (Dynamic Clarification):
- If any information is missing (e.g., which environment to rollback), Kubiya engages in a feedback loop.
- It prompts the user to clarify or fill in gaps and provides progress updates on task execution.
Sub-agent Invocation (Execution Engine):
Once planning is complete, Kubiya invokes sub-agents tied to tools like:
- Terraform (infra provisioning)
- GitHub (code versioning or repo checks)
- CI/CD tools (e.g., GitHub Actions, Jenkins)
- Approvals (gating steps for compliance or team review)
Completion (Result & Logs):
Once the task is complete, Kubiya:
- Send success notifications.
- Share logs or outputs.
- Ensures the operation is auditable and traceable.
Building on the vision of intelligent, self-adaptive operations, Kubiya delivers AIOps through an agent-based orchestration model designed for the cloud-native world. Unlike static scripts or chatbots, Kubiya’s agents understand context, remember past interactions, scope permissions by workspace or team, and execute complex workflows from simple natural language prompts in Slack, Teams, or CLI. These agents bridge user intent with action by tapping into Kubernetes, Terraform, Jenkins, Argo CD, and other AIOps tools already in place, allowing developers and operators to ask for what they need (“roll back the last deploy,” “scale checkout service”) and receive results without navigating scripts or dashboards.
Kubiya doesn’t just automate tasks, it understands them. When an SRE requests a rollback, the agent determines the correct repo, cluster, namespace, deployment, and toolchain to use, based on real-time context and memory. With explainability and human confirmation built in, Kubiya ensures every action is traceable and safe, making intelligent AI for IT operations not just possible but practical. With that foundation laid, let’s now explore how this plays out in real-world use cases that DevOps and SRE teams encounter every day.
Step-by-Step: Orchestrating AIOps with Kubiya
Kubiya delivers AIOps capabilities through a structured, agent-based model that integrates into your existing toolchains and workflows. Its architecture emphasizes secure, scoped automation with persistent memory, making it ideal for cloud-native DevOps and SRE use cases.
1. Deploying Scoped, Memory-Aware Agents
Kubiya agents are scoped per team, project, or workspace, each with its own memory context and permission boundaries. As documented in Kubiya’s platform overview, this ensures agents can recall recent deployment history, approved changes, or preferred environments without leaking information between tenants.
For example, when a user requests: “rollback the latest deploy in dev,” the agent knows which service, cluster, and toolchain to use based on previous context.
2. Generating Workflows with Natural Language
Kubiya supports workflow creation via its Agent Development Kit (ADK), allowing users to describe operational tasks in plain English. These prompts are converted into structured execution plans, which can be edited as YAML files or via a visual interface using DAG-based logic (docs).
These workflows are not AI-generated runtime guesses, they are deterministic pipelines with clearly defined steps, conditionals, and approval logic.
3. Executing Workflows with Kubiya Runners
Workflows are executed using Kubiya Runners, which are lightweight, containerized operators deployed within your Kubernetes cluster or hosted by Kubiya (docs). Each runner executes steps securely and locally, ensuring no infrastructure data is exposed to third parties.
Runners spin up on-demand, run the action (e.g., terraform plan, kubectl rollout restart, or curl request), and shut down, enabling scalable, stateless automation without long-lived infrastructure.
4. Connecting to Your Existing Toolchains
Kubiya doesn’t replace your CI/CD, infrastructure, or monitoring tools, it orchestrates them. Agents can invoke workflows across GitHub Actions, Jenkins, ArgoCD, and Terraform (docs), based on natural-language prompts or internal triggers.
For example, an agent might trigger a GitHub Actions job to run end-to-end tests before promoting a build. Or, it could apply a Terraform change after validating user approval and environment status.
5. Maintaining Context Across Interactions
Because agents maintain scoped memory, they can reference past conversations, tool credentials, preferred regions, or previous deployment outcomes. This context persistence reduces back-and-forth and eliminates repetitive re-specification.
A command like: “create a sandbox like the one I did last week” is valid, Kubiya retrieves the correct config, environment, and access scope tied to that user and workspace.
6. Enabling Serverless Control Planes (MCP)
Kubiya has extended its AIOps vision into a Serverless Multi-Cloud Platform (MCP) architecture. Built with AWS Lambda, Step Functions, and DynamoDB, this model removes persistent control plane overhead, ideal for ephemeral, zero-footprint automation.
In such setups, an inbound request, say, via an API Gateway or Slack, can trigger an agent that:
- Validates input (e.g., region, IAM policy)
- Enforces security/compliance checks
- Runs a Terraform or Kubernetes operation
- Returns results with logs or diffs for user confirmation
This approach decouples automation from monolithic servers, enabling faster scale, safer execution, and event-driven responsiveness.
AIOps vs Traditional Automation: What’s the Real Difference?
While traditional automation focuses on predefined scripts and static workflows, typically triggered by “if X, then Y” logic, AIOps brings adaptability, learning, and contextual awareness to operations. This is a critical distinction in cloud-native environments, where systems are dynamic, workloads are ephemeral, and root causes are rarely obvious.
Traditional automation operates without memory or state, by running predefined scripts or rules that execute tasks statelessly. It requires humans to encode all possible failure scenarios ahead of time. For example, a script might restart a Kubernetes pod if CPU usage crosses a threshold. But what if the CPU spike is caused by a known safe batch job that runs every Tuesday at 2 AM? That’s where automation becomes noisy, and often wrong.
AIOps, by contrast, remembers past events, correlates signals across services, and reasons before acting. Using historical data, it can infer that a recurring Tuesday spike is expected and suppress irrelevant alerts. It also learns from incidents, adapting thresholds over time and adjusting its behavior based on actual system trends, not just static configurations.
| Feature | Traditional Automation | AIOps |
|---|---|---|
| Logic Type | Static rules/scripts | Adaptive, ML-based reasoning |
| Context Awareness | None | Retains state and historical memory |
| Alert Handling | Reactive, threshold-based | Predictive, contextual, deduplicated |
| Root Cause Analysis | Manual investigation | Automated correlation and RCA |
| Learning from Past Events | No | Yes |
| Scalability in Dynamic Envs | Limited | Highly scalable in ephemeral environments |
| User Interaction | Requires deep tooling knowledge | Natural language via chat, CLI, workflows |
Best Practices for Implementing AIOps in DevOps Workflows
To successfully embed AIOps in daily operations, teams should define strong guardrails. This includes using dry-run modes, approval workflows, and requiring confirmation for high-impact actions. Even intelligent systems benefit from human validation, especially when managing critical resources.
Memory use should be intentional and scoped. Agents should remember relevant deployment or incident history per project or team, but not cross contamination across unrelated workspaces. This keeps troubleshooting sharp and avoids context bloat. Equally important is maintaining explainable automation. Every agent-triggered action should have an audit trail and clear reasoning visible to the user.
Lastly, infrastructure needs to be instrumented for ML-readiness. That means consistent tagging, normalized metrics, and properly structured logs. These practices help AIOps systems make accurate decisions and reduce false positives, creating clean input pipelines for smart output downstream.
AIOps Isn’t a Silver Bullet, Understand the Limits
While powerful, AIOps is not magic. If observability pipelines are misconfigured or missing key metrics, even the smartest agents won’t help. Poor signal quality leads to missed detections or false alarms, garbage in, garbage out.
Additionally, while large language models can infer context and suggest actions, hallucinations, where the model suggests something inaccurate, are a real risk. That’s why Kubiya enforces validation logic, role-based safeguards, and human-in-the-loop confirmations. Intelligent systems are meant to assist, not replace, human operations. True autonomy in production demands mature oversight, reliable data, and measured trust.
Conclusion
AIOps marks a significant evolution for SRE and DevOps teams striving to scale with confidence. It enables faster incident response, reduces operational noise, and helps teams move from reactive firefighting to proactive stability. When combined with platforms like Kubiya, AIOps becomes not just intelligent, but actionable. Kubiya’s agents bring context-aware automation, memory, and safe orchestration into the daily toolkit of operations engineers, freeing teams to focus on reliability and innovation over routine toil.
However, realizing the true value of AIOps depends on thoughtful implementation. Clean telemetry, strategic memory scoping, explainable workflows, and built-in confirmations are key. When done right, AIOps isn’t just automation, it becomes your team's operational co-pilot.
FAQs
1. Is AIOps suitable for small teams?
Yes. Even lean teams benefit from AIOps, particularly when managing noisy on-call rotations or limited engineering resources. Intelligent assistants help scale expertise without scaling headcount.
2. What is the difference between DevOps and AIOps?
DevOps improves the software development lifecycle, while AIOps improves the efficiency and automation of IT operations, often using AI to augment DevOps practices.
3. Is AIOps part of observability?
While observability and AIOps are related and often used together, AIOps is not strictly part of observability. Observability focuses on providing the data and insights needed to understand a system's behavior, while AIOps leverages AI and machine learning to analyze that data, automate tasks, and improve operations.
About the author
Amit Eyal Govrin
Amit oversaw strategic DevOps partnerships at AWS as he repeatedly encountered industry leading DevOps companies struggling with similar pain-points: the Self-Service developer platforms they have created are only as effective as their end user experience. In other words, self-service is not a given.